2021. 5. 14. 16:17ㆍData science/Python
Pre-Processing: Data cleaning, Wrangling
- process of converting or mapping data from one raw form into another format to make it ready for further analysis
Dealing with missing values in Python
- check the actual data
- drop the missing values (variable, data entry)
- replace the missing values with an average or similar data points ( less accurate )
- replace it by frequency
- replace it based on other functions
- leave it as missing data
* How to deal with missing values for categorical data
- replace the missing values with the mode of the particular column
- replace the missing value with the value that appears most often in the particular column
How to drop missing values in Python
- use dataframes.dropna()
df.dropna(subset=["price"], axis=0, inplace=True)- to modify the dataframe, use inplcae=True
df.dropna(axis=0)
#This will drop all rows that contain a nan
- use dataframe.repalce(missing_value, new_value)
mean =df["normalized-losses"].mean()
df["normalized-losses"].replace(np,nan, mean)
Data formatting in Python
- Data collected from different places, uses and format
- ensure the data consistently and easily understand
- allows the users to make a meaningful comparison
- convert the data and rename the column
df["city-mpg"] = 235/df["city=mpg"]
df.rename(columns={"city-mpg": "city-L/100km"}, inplace=True)
- Incorrect data types : may behave strangely or return odd result.
- to identify the data types : dataframe.dtype()
- to convert data types: dataframe.astype()
df[["price"]] = df[["price"]].astype("float")
Data Normalization in Python
- so as to make the range of the values consistent, normalize the variables
- fair comparison with different features
- before the normalization, it is hard to compare and the income will influence the result more
| age | income | Normalization | age | income |
| 20 | 100000 | 0.2 | 0.2 | |
| 30 | 20000 | 0.3 | 0.04 | |
| 40 | 500000 | 0.4 | 1 |
- after the normalization, similar value range, intrinsic influence on an analytical model
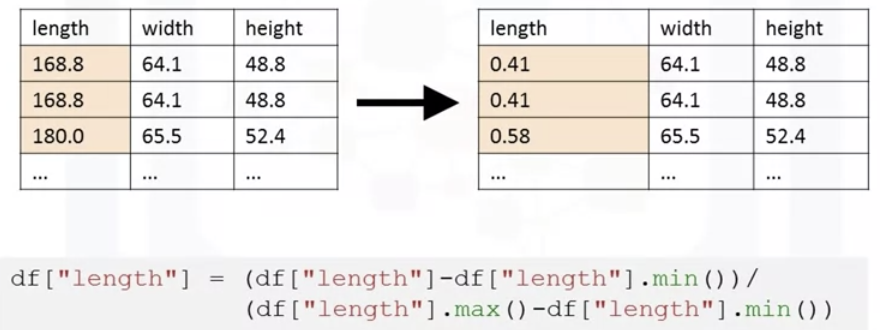
Method of normalizing data

1. simple feature scaling ( between 0 to 1)
2. Min-Max
3. z-score (between -3 to 3)


Binning in Python
- Binning is grouping Values into bins
- low, medium and high range
bins=np.linspace(min(df["price"]), max(df["price"](, 4)
group_name = ["low", "medium", "high"]
df["price-binned"]= pd.cut(df["prcie"], bins, labels=group_names, include_lowest=True)
- Since we are building 3 bins of equal length, there should be 4 dividers, so numbers_generated=4.
- visualizing binned data on the histograms
Turning categorical variables into quantitative variables in Python
- problem: most statistical models cannot take in the objects/strings as input and for model training only take a number as input(numeric format)
- use get_dummies() : covert categorical variables to dummy variables(0 or 1)
- pd.get_dimmies(df['fuel(this is column name)'])
https://gist.github.com/db7e7c1ae331c4160b2ce26a0be44bef