2022. 10. 9. 01:06ㆍData science/Database
1. Most common data types
: Data can be classified according to its main production source
1) Primary Data: Generated/developed and implemented by the user
2) Secondary Data: Collected from Databases which were processed and available by third parties.
| Primary Data | Secondary Date |
| - Own controlled data - generated by the research like surveys, interviews, observations, data mining methods etc. - to be cleaned, structured and analysed - it can be tailored to the research - a full consideration of ethical and legal issues around data implication |
- pre-processed data, i.e. census data - can be qualitative or quantitative - has a given structure - attributes are already selected - Validated and cleaned - the majority of secondary data is not of good quality, unfortunately(not always good, though it's been processed) - may or not have issues with privacy - should be cleaned of errors, inconsistencies or missing values. But not always they have been. - Various remits of public policy - free from ethical considerations around privacy, needs to be referenced - useful in research, comparability, useful for triangulation(Social science) |
**Difference between Primary Data and Secondary Data: https://www.javatpoint.com/primary-data-vs-secondary-data
Difference between Primary Data and Secondary Data - javatpoint
Difference between Primary Data and Secondary Data with list of top differences and real time examples including images, dog, cat, gross, net, java, database, science, general, english etc.
www.javatpoint.com

2. Data Resolution
: Different datasets have different resolution
1) Temporal resolution (시간 해상도): The majority of the dataset is temporal.
2) Spatial Resolution (공간 해상도): Critical issue in quantitative spatial data, evidence of phenomena carrying by data can be identified at a given scale, Aggregation/Disaggregation may lead to lost representativeness, MAUP and Ecological Fallacy
| Temporal Resolution | Spatial resolution |
| - Data goes for a long time - i.e. (1) 5, 10 years of population census, employment, deprivation (2) Day, Month, and Year of individual data, business data (3) Millisecond, second, hour of market data(Stock, finance), business data, transport/communications data etc. |
- Data could be divided by units, etc. - It doesn't only mean the space, but also individuals like households. i.e. (1) Individual, Business, Trips (2) Geographical units: output areas, LSOA, MSOA, Local Authorities |
*Modifiable Area Unit Problem (MAUP)
: A source of bias that can radically affect data analysis and interpretation
: It can occur when data aggregations and the resulting summary values are influenced by choice of boundaries to which the data is aggregated. Since the variation in the spatial units is used for aggregation and it turns out to be the cause of variation in statistical results.

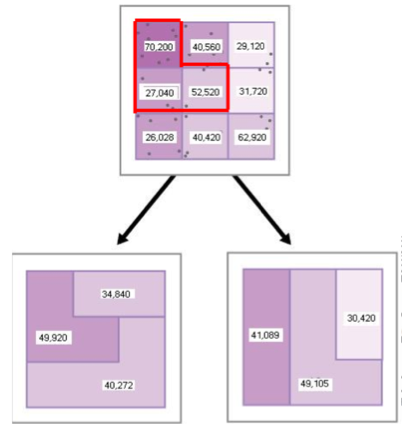
: Look at the below example. Blocks represent a census unit. We are trying to estimate of average household income for each census unit. But the results can be totally different numbers even though you chose the exact same number of blocks. You can aggregate them into different shapes or ways due to different aggregations. It will end up changing or losing the data.
-> 2 Main problems with MAUP
- Scale effect or aggregation effect: we obtain potentially different inferences as we aggregate to more significant regions
- Grouping effect or the zoning effect: inferences can change depending on how we choose to aggregate (for the exact area size).
*Ecological Fallacy
The mistake of assuming that where relationships are found among aggregated data(group), these relationships will also be found among individuals or households. Which is not always true.
: When analyses based on group data lead to different conclusions than we would obtain from the individual-level data
-> 2 main effects
- Aggregation bias: the effect of the spatial aggregation itself.
- Specification bias: the distribution of confounding variables is different under aggregation.
*Changed of Support Problem
: COSP refers to compatibility issues of different variables measured at different scales.
i.e. A hierarchy of geographies might exist, but usually, they don't match. Think of a Map of certain countries.
: To tackle COSP, find a common aggregation scale or use interpolation/imputation methods.

'Data science > Database' 카테고리의 다른 글
| Week 1. Data Quality (0) | 2022.10.09 |
|---|---|
| Week 1. MetaData & ParaData (0) | 2022.10.09 |
| Week1. What is a database? (0) | 2022.10.02 |
| [IBM]Databases and SQL for Data Science with Python - JOIN Statements (0) | 2021.05.09 |
| [IBM]Databases and SQL for Data Science with Python - ACID TRANSACTIONS (0) | 2021.05.09 |