[IBM]Python for Data Science, AI & Development - API Excercise
2021. 5. 11. 12:31ㆍData science/Python
반응형
!pip install pycoingecko
#to retrieve cryptocurrency data such as price, volume, market cap,
#and exchange data from CoinGecko using code

!pip install plotly
#To summarize, matplotlib is a quick and straightforward tool for creating visualizations
#within Python. Plotly, on the other hand, is a more sophisticated data visualization
#tool that is better suited for creating elaborate plots more efficiently.

!pip install mplfinance
#It generated static candlestick charts.
coderzcolumn.com/tutorials/data-science/candlestick-chart-in-python-mplfinance-plotly-bokeh#1
Candlestick Chart in Python (mplfinance, plotly, bokeh, bqplot & cufflinks) by Sunny Solanki
Candlestick Chart in Python (mplfinance, plotly, bokeh, bqplot & cufflinks)
coderzcolumn.com
Pandas is an API
import pandas as pd
import numpy as np
import plotly.graph_objects as go
from plotly.offline import plot
import matplotlib.pyplot as plt
import datetime
from pycoingecko import CoinGeckoAPI
from mplfinance.original_flavor import candlestick2_ohlc
#Create a dictoinary
dict_={'a':[11,21,31],'b':[12,22,32]}
#Transfer to the data frame to communicate with the API
df=pd.DataFrame(dict_)
type(df)
#Call the method -> API will return the result
df.head()
df.mean()
REST APIs
Rest API’s function by sending a request, the request is communicated via HTTP message. The HTTP message usually contains a JSON file. This contains instructions for what operation we would like the service or resource to perform. In a similar manner, API returns a response, via an HTTP message, this response is usually contained within a JSON.
cg = CoinGeckoAPI()
bitcoin_data = cg.get_coin_market_chart_by_id(id='bitcoin', vs_currency='usd', days=30)

type(bitcoin_data )
#-> dict
bitcoin_price_data = bitcoin_data['prices']
bitcoin_price_data[0:5]
#Result
#[[1618059897067, 60183.81465738429],
# [1618063629386, 60409.340168074086],
# [1618067058987, 60314.64432505629],
# [1618070602235, 60221.75940319549],
# [1618074264346, 60179.80103929574]]#Turn the data into Pandas DataFrame
data = pd.DataFrame(bitcoin_price_data, columns=['TimeStamp', 'Price'])
#Convert the timestamp to datatime
data['Date'] = pd.to_datetime(data['TimeStamp'], unit='ms')#group by the Date and find the min, max, open, and close for the candlesticks.
candlestick_data = data.groupby(data.Date.dt.date, as_index=False).agg({"Price": ['min', 'max', 'first', 'last']})
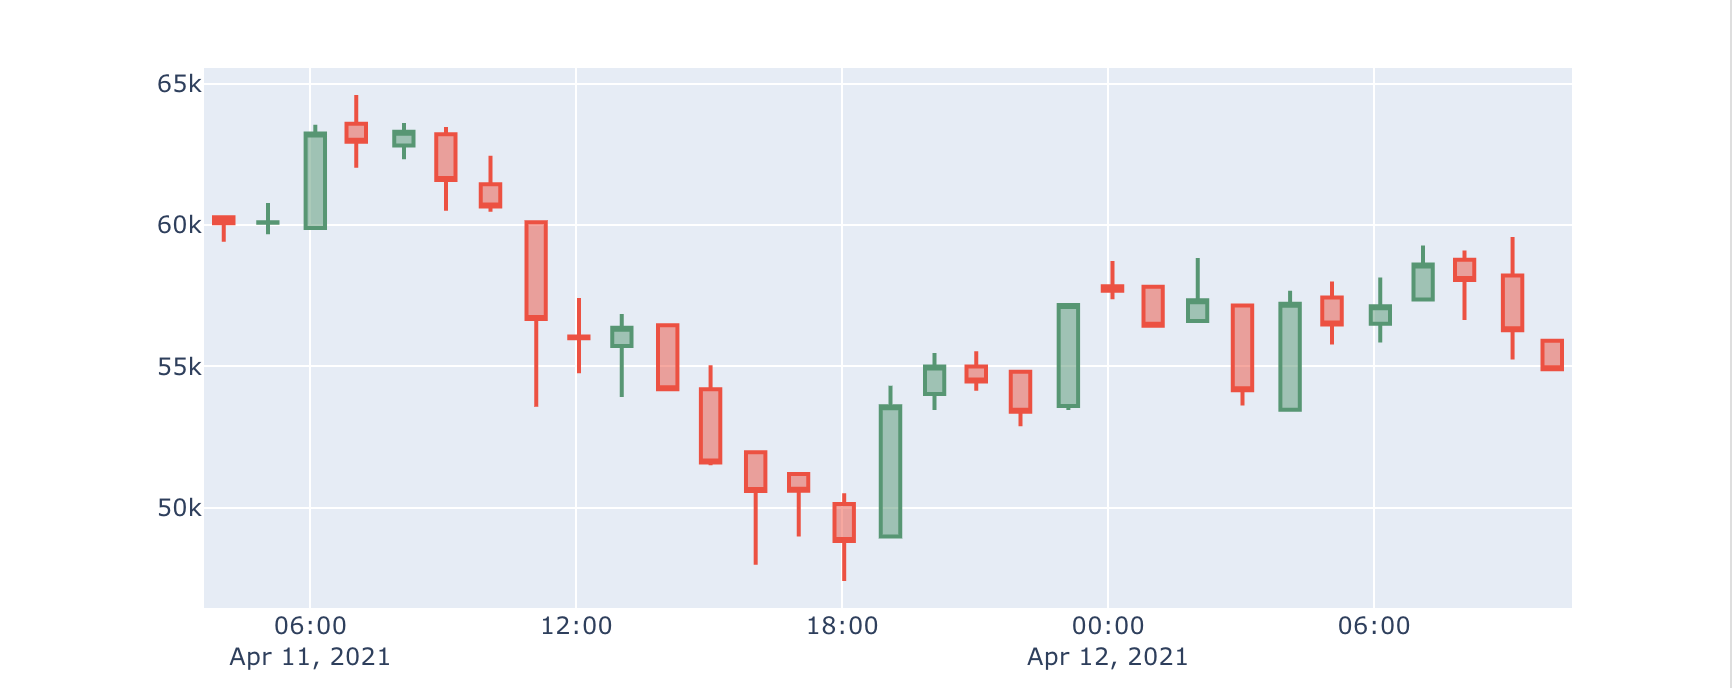
#use plotly to create our Candlestick Chart.
fig = go.Figure(data=[go.Candlestick(x=data['Date'],
open=candlestick_data['Price']['first'],
high=candlestick_data['Price']['max'],
low=candlestick_data['Price']['min'],
close=candlestick_data['Price']['last'])
])
fig.update_layout(xaxis_rangeslider_visible=False)
fig.show()
반응형